> ## Documentation Index
> Fetch the complete documentation index at: https://aibco.mintlify.site/llms.txt
> Use this file to discover all available pages before exploring further.
# Analyze Widget Performance in the Logs Page
> Explore the Logs page tabs to track renders, funnel drop-off, product clicks, conversations, and credit history from your AIBCO widget.
The Logs page is your central hub for understanding how visitors interact with your AIBCO widget. Go to **Dashboard → Logs** (`aibco.ai/dashboard/logs`) to review render history, measure visitor drop-off, see which products get the most attention, read chat transcripts, and check credit usage.
This page breaks down each of the six analytics tabs, how to read them, and what the numbers mean for your business.
## Renders
The **Renders** tab lists every render request your widget has received. Each row shows the product, status, and final outcome, so you can spot successes and failures at a glance.
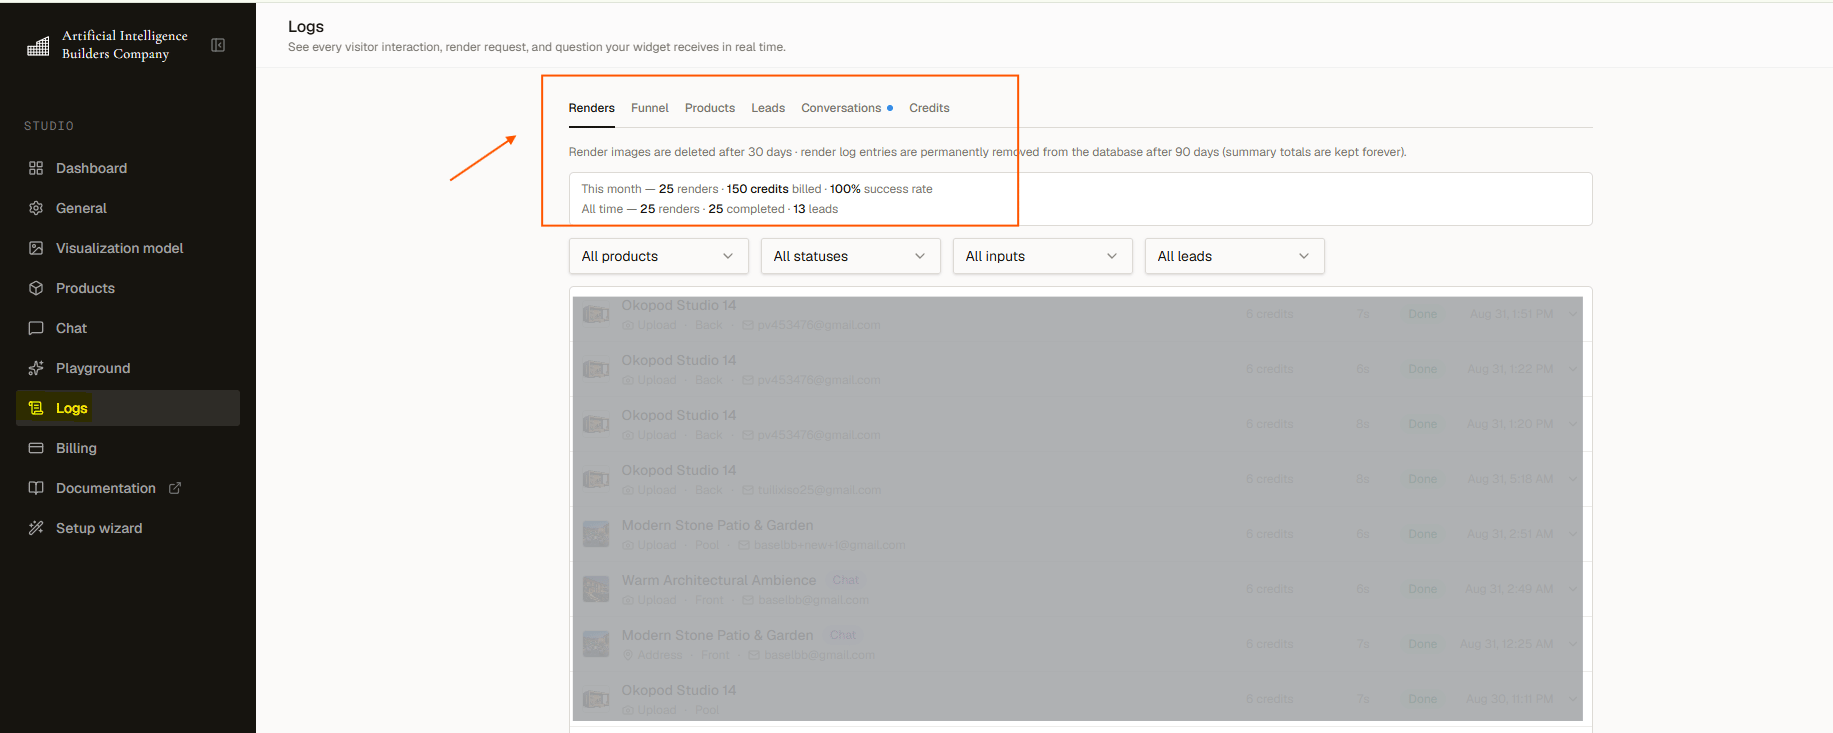 At the top of the tab, a summary line shows:
| Period | Metrics |
| -------------- | ------------------------------------------- |
| **This month** | Renders, credits billed, success rate |
| **All time** | Total renders, completions, leads generated |
Use the filters to narrow the list by:
* **Product** — see results for a single design
* **Status** — Done or Failed
* **Input type** — Address or Upload
* **Email captured** — whether the visitor became a lead
## Funnel
The **Funnel** tab shows where visitors drop off as percentage bars. This helps you identify which step is costing you the most engagement.
At the top of the tab, a summary line shows:
| Period | Metrics |
| -------------- | ------------------------------------------- |
| **This month** | Renders, credits billed, success rate |
| **All time** | Total renders, completions, leads generated |
Use the filters to narrow the list by:
* **Product** — see results for a single design
* **Status** — Done or Failed
* **Input type** — Address or Upload
* **Email captured** — whether the visitor became a lead
## Funnel
The **Funnel** tab shows where visitors drop off as percentage bars. This helps you identify which step is costing you the most engagement.
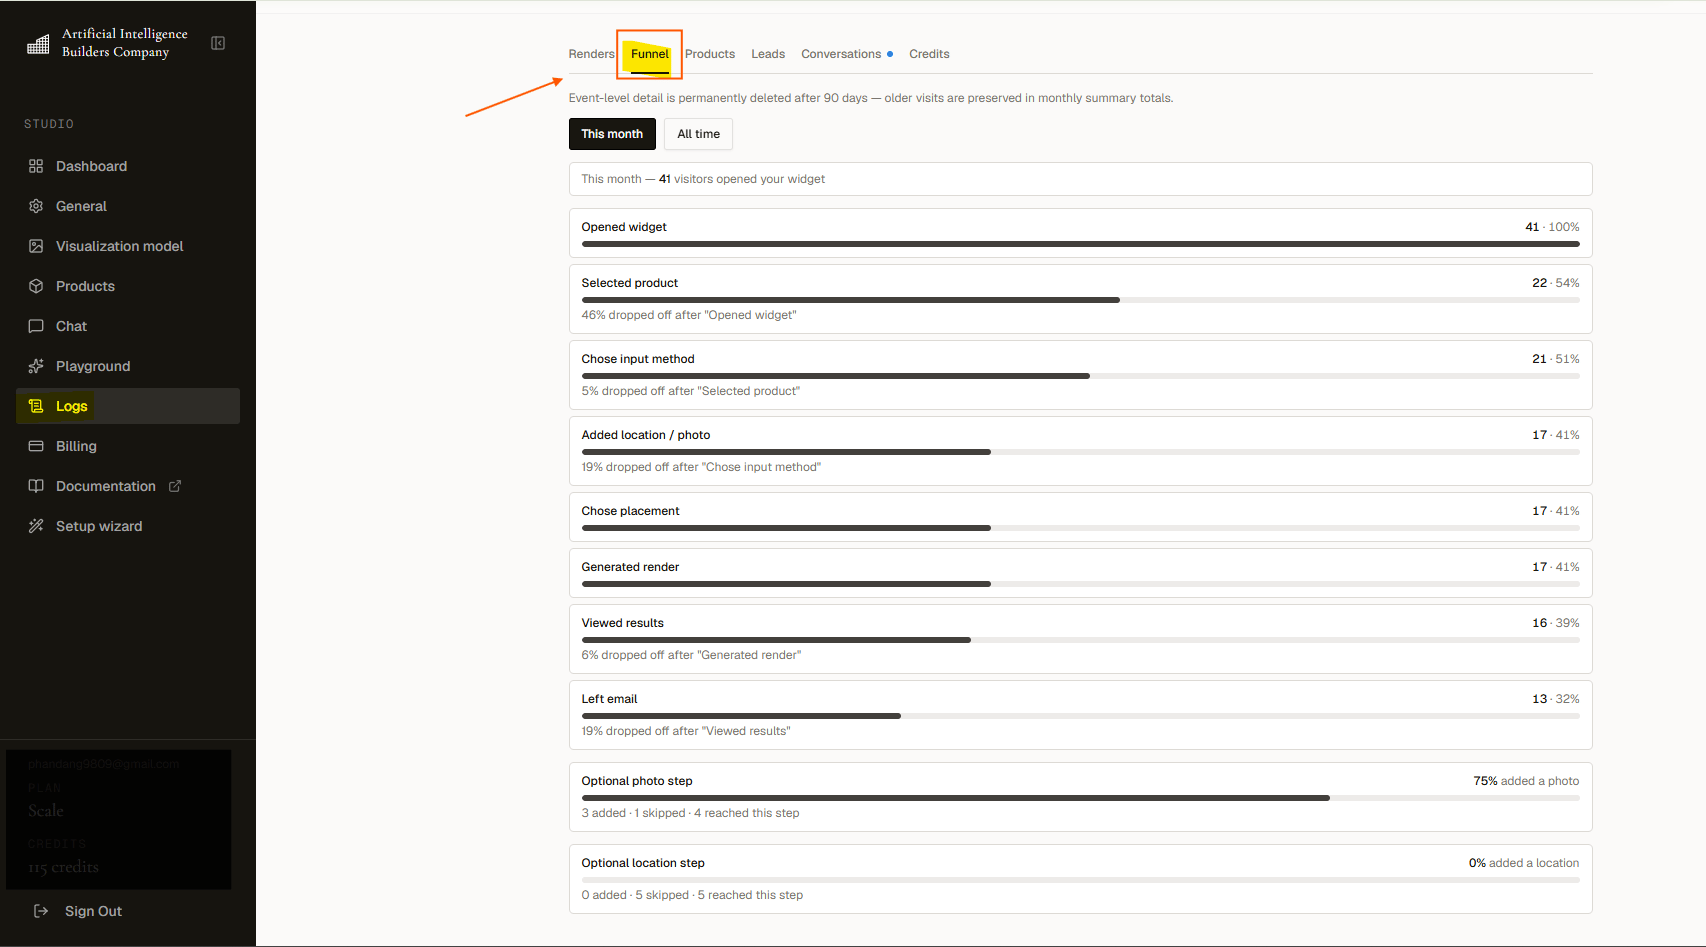 The standard steps are:
| Step | What it tracks |
| -------------------- | ----------------------------------------------- |
| Opened widget | The widget loaded and was opened |
| Selected product | A design was picked from your catalog |
| Chose input method | Address or photo upload selected |
| Added location/photo | The visitor actually supplied the input |
| Chose placement | A placement on the property was selected |
| Generated render | A visualization job was started |
| Viewed results | The visitor saw the finished images |
| Left email | Contact details were submitted, creating a lead |
Two steps show an added-vs-skipped split:
* **Optional photo step**
* **Optional location step**
A high skip rate on these optional steps is normal, not a sign of a problem.
Toggle between **This month** and **All time** to compare recent performance against your full history.
## Products
The **Products** tab ranks your designs by click count, with a bar showing each product relative to the most-clicked one. This tells you which products are drawing interest and which may need better images or a new description.
The summary line above the list shows **total clicks** and the number of **distinct visitors across your whole widget**. That visitor count is an overall figure, not per-product. The per-product number is clicks only: if one visitor clicks three different products, that counts as three clicks.
Toggle between **This month** and **All time**.
## Leads
Leads are visitors who submitted their contact details through a render or chat interaction. The **Leads** tab shows every captured lead with filters and CSV export. This tab is never locked, even on the Free plan.
For full details on how leads are captured, filtered, and exported, see the dedicated [Leads](/logs/leads) page.
## Conversations
The **Conversations** tab covers chat performance and transcripts for the current month.
At the top, four cards summarize results:
| Card | What it shows |
| ---------------- | -------------------------------------------------- |
| Conversations | How many chats started |
| Became a lead | How many produced contact details, with percentage |
| Reached a render | How many led to a visualization, with percentage |
| Messages each | Average messages per conversation |
Below the cards, every conversation is listed with:
* Time started
* Summary
* Message count (**Msgs**)
* Credits used (**Cr**)
Click any row to open the full transcript, view the visitor's contact details, and see any renders they generated. You can delete conversations individually.
## Credits
The **Credits** tab shows your current balance and a complete transaction history. Every debit, refund, and top-up is logged with a timestamp, amount, and running balance.
For a breakdown of what each action costs and how charging works, see the dedicated [Credits](/logs/credits) page.
## Free plan: your analytics window
Free accounts receive full analytics for **14 days from signup**. During this period, all six tabs are fully accessible. The analytics tabs also display a countdown so you know how much time remains.
After the 14 days, the **Renders**, **Funnel**, **Products**, and **Conversations** tabs lock and display the message:
> "Your free analytics period has ended"
An upgrade button appears to unlock the view.
Three key points to keep in mind:
1. **Locking is not deleting.** The view is hidden, but data collection continues in the background. Your data keeps accumulating while the tabs are locked.
2. **Upgrading reopens everything instantly.** When you upgrade, you see your full history again, not just data from the upgrade date onward.
3. **Leads and Credits are never locked.** Your contact details and spending history remain visible and accessible on every plan, including Free.
Locking and expiry are different things. The analytics gate is reversible: upgrade and the view returns. The retention window is not reversible: row-level detail older than 90 days is deleted on every plan. A long stretch on the locked Free plan may mean some detail ages out before you can view it again. Export your leads regularly.
If you are ready to unlock your full analytics history, visit [Billing](/billing) to upgrade your plan.
The standard steps are:
| Step | What it tracks |
| -------------------- | ----------------------------------------------- |
| Opened widget | The widget loaded and was opened |
| Selected product | A design was picked from your catalog |
| Chose input method | Address or photo upload selected |
| Added location/photo | The visitor actually supplied the input |
| Chose placement | A placement on the property was selected |
| Generated render | A visualization job was started |
| Viewed results | The visitor saw the finished images |
| Left email | Contact details were submitted, creating a lead |
Two steps show an added-vs-skipped split:
* **Optional photo step**
* **Optional location step**
A high skip rate on these optional steps is normal, not a sign of a problem.
Toggle between **This month** and **All time** to compare recent performance against your full history.
## Products
The **Products** tab ranks your designs by click count, with a bar showing each product relative to the most-clicked one. This tells you which products are drawing interest and which may need better images or a new description.
The summary line above the list shows **total clicks** and the number of **distinct visitors across your whole widget**. That visitor count is an overall figure, not per-product. The per-product number is clicks only: if one visitor clicks three different products, that counts as three clicks.
Toggle between **This month** and **All time**.
## Leads
Leads are visitors who submitted their contact details through a render or chat interaction. The **Leads** tab shows every captured lead with filters and CSV export. This tab is never locked, even on the Free plan.
For full details on how leads are captured, filtered, and exported, see the dedicated [Leads](/logs/leads) page.
## Conversations
The **Conversations** tab covers chat performance and transcripts for the current month.
At the top, four cards summarize results:
| Card | What it shows |
| ---------------- | -------------------------------------------------- |
| Conversations | How many chats started |
| Became a lead | How many produced contact details, with percentage |
| Reached a render | How many led to a visualization, with percentage |
| Messages each | Average messages per conversation |
Below the cards, every conversation is listed with:
* Time started
* Summary
* Message count (**Msgs**)
* Credits used (**Cr**)
Click any row to open the full transcript, view the visitor's contact details, and see any renders they generated. You can delete conversations individually.
## Credits
The **Credits** tab shows your current balance and a complete transaction history. Every debit, refund, and top-up is logged with a timestamp, amount, and running balance.
For a breakdown of what each action costs and how charging works, see the dedicated [Credits](/logs/credits) page.
## Free plan: your analytics window
Free accounts receive full analytics for **14 days from signup**. During this period, all six tabs are fully accessible. The analytics tabs also display a countdown so you know how much time remains.
After the 14 days, the **Renders**, **Funnel**, **Products**, and **Conversations** tabs lock and display the message:
> "Your free analytics period has ended"
An upgrade button appears to unlock the view.
Three key points to keep in mind:
1. **Locking is not deleting.** The view is hidden, but data collection continues in the background. Your data keeps accumulating while the tabs are locked.
2. **Upgrading reopens everything instantly.** When you upgrade, you see your full history again, not just data from the upgrade date onward.
3. **Leads and Credits are never locked.** Your contact details and spending history remain visible and accessible on every plan, including Free.
Locking and expiry are different things. The analytics gate is reversible: upgrade and the view returns. The retention window is not reversible: row-level detail older than 90 days is deleted on every plan. A long stretch on the locked Free plan may mean some detail ages out before you can view it again. Export your leads regularly.
If you are ready to unlock your full analytics history, visit [Billing](/billing) to upgrade your plan.